The technology underneath
What the Speed-Test Data Actually Measures, and What It Misses
Two widely cited datasets tell different stories about broadband quality — because they are asking different questions
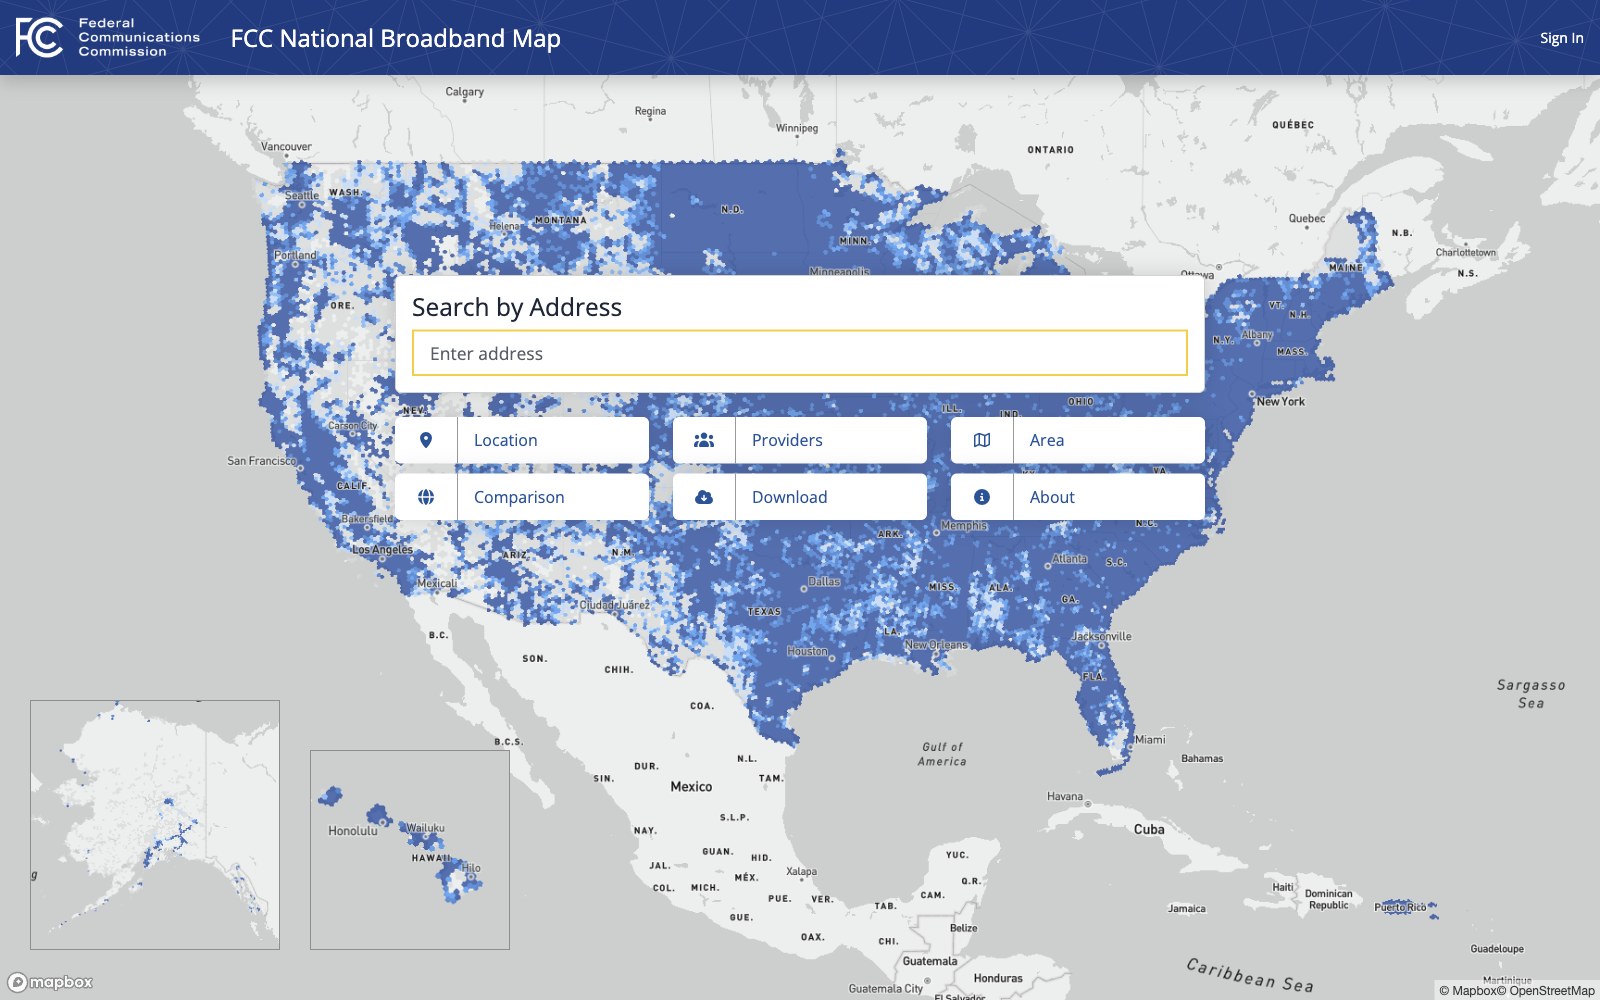
The national map is assembled from provider self-reporting, which is the reason the challenge process exists.
Photo: broadbandmap.fcc.gov
What the Tests Capture
When a household runs a speed test, it measures one thing: the throughput available between that device and a remote server at the moment the test runs. Ookla's Speedtest platform, which supplies data to the FCC and is licensed by regulators worldwide, selects the server closest to the user and measures peak performance over a short burst. The result is optimistic by design — Ookla's methodology targets the best achievable speed on an uncongested path, which is why its figures tend to be higher than what a household experiences during an evening streaming session or a morning video call.
M-Lab's Network Diagnostic Tool (NDT), maintained by a consortium that includes Google, Princeton's Center for Information Technology Policy, and the Open Technology Institute, takes a different approach. NDT runs a single-stream test, which tends to report lower figures than multi-stream tools such as Ookla's. Its data is published as open access and has been used in academic research precisely because the raw logs are available for independent audit. M-Lab's published methodology distinguishes between single-stream and multi-stream results, a distinction that matters when comparing figures across studies.

Selling retail service means staffing a room like this one continuously, whoever owns the strand.
Photo: Fernando Narvaez / Pexels
Neither test captures what users actually experience across a full month of service. Both measure from the device outward — meaning Wi-Fi interference, router quality, and the number of simultaneous users inside the home all contaminate the result. A household on a 200 Mbps cable plan may test at 85 Mbps because of an aging router; a neighbouring household on the same node may test at 210 Mbps. Both results enter the dataset. Neither is wrong as a measurement; both are ambiguous as evidence about the network.
The Sampling Problem
The deeper issue is who runs a speed test at all. Ookla's dataset is opt-in: people who visit Speedtest.net or use an embedded tool are disproportionately those who believe they have a problem or who are technically curious. Researchers at the Benton Institute for Broadband and Society have noted that this self-selection makes it unreliable as a census of actual service quality across a geography. A neighbourhood with satisfied subscribers generates few test results; a neighbourhood with chronic congestion generates many. Aggregate the data carelessly and the underperforming area appears overrepresented — which can, paradoxically, make it look worse than the map suggests, or skew state-level averages in either direction.

Measurement platforms publish their methodology alongside their datasets, which is what makes their limits arguable.
Photo: measurementlab.net
M-Lab's data carries a different bias. Its tool is embedded in Google's network diagnostics and several ISP self-help portals, meaning its sample skews toward users actively troubleshooting a complaint. Neither dataset is a random sample of the population; neither can stand alone as proof that a given address is served or unserved under the FCC's current 100/20 Mbps benchmark.
Survey methodology offers a partial corrective. Pew Research Center's broadband adoption surveys ask respondents directly whether they have home internet service, what type, and how much they pay — questions that reach non-users and low-adopters who never run a speed test. Pew's broadband research consistently shows that cost and perceived relevance, not physical unavailability, explain a large share of non-adoption. That finding is invisible in any speed-test dataset, which by definition captures only households that are already connected.
Why This Matters for Policy
The FCC's national broadband map, which determines how BEAD's $42.45 billion in federal funding is allocated across states, relies on provider-reported availability data rather than speed-test results. Speed-test data enters the picture during the challenge process, when a local government or resident disputes a provider's claim that an address is served. M-Lab data has been submitted in challenge filings; Ookla data has been cited by providers defending their coverage claims. Both uses strain the data beyond what the methodology supports.
The honest reading is that speed-test datasets are useful for detecting broad patterns — regional congestion, technology-type disparities, year-over-year trends — and poor substitutes for address-level service verification. A municipal government commissioning a feasibility study should treat speed-test results as a signal worth investigating, not a finding that resolves the question. The test tells you what one device measured once. It does not tell you what the network delivers to everyone on the block, every hour of the day.